Short Communications Download PDF
A Study on the Water Quality Assessment of Nallavagu River in Sangareddy
Received: May 09, 2019; Published: May 22, 2019
Abstract
This paper assessed the water quality of Nallavagu River in Sangareddy City in Telangana state using a fuzzy comprehensive evaluation and grey clustering evaluation methods. Unsafe drinking water is one of the main concerns in developing countries. The study of water quality of Nallavagu is taken up as this drinking water source is more susceptibility to the growing urbanization and industrialization due to its close vicinity to Sangareddy city. Unsafe drinking water is one of the main concerns in developing countries. As a part of this, samples were collected from the lake during three different seasons of 2018 and analyzed for various physico-chemical parameters like pH, Electrical Conductivity (EC), Total Dissolved Solids (TDS), Total Hardness (TH), Carbonates (CO32-), Bicarbonates (HCO3-), Total Alkalinity (TA), Chloride (Cl-), Sodium (Na+), Potassium (K+), Calcium (Ca2+) and Magnesium(Mg2+) were analyzed. The analytical results indicated that lake waters are slightly acidic to alkaline in nature and found that the physic-chemical parameters of lake waters are higher than the prescribed standard limits for drinking purposes (IS 10500:2012). Finally, based on analyzing the corresponding reasons, this paper put forward some suggestions
Introduction
Water assets are under massive pressure due to increasing demands for more and better quality water; demands which are in turn habituated by social, political and environmental factors [1]. Over the few decades, competition for economic development, related to ascension in population and urbanization, has brought in important changes in land use, leading to additional demand of waterfor agriculture, domestic and industrial activities [2]. Water pollution upsets drinking water, rivers, lakes and oceans all over the world resulting in threat to human health, irrigation and natural environment. Changing of surface water body quality is influenced by long term of drought, decline in discharge, increase in salinity and waste disposal. Lakes are the major sources of drinking and domestic usage for rural and urban population of India. Lakes are the planet’s most important fresh water sources and represent additional storage capacity of hydrologic systems. Lake is a watershed area in which its quality depends upon every component of that ecosystem [3].
Regular or manmade variations in the quality or quantity of water will not only affect the dependent receivers but also the ecological water balance of the region [4]. For evaluating suitability of lake water bodies for drinking purposes understanding its physico chemical characteristics is necessary. Periodic monitoring and assessment of water quality helps to develop management strategies to control surface water pollution [5]
Nallavagu lake in Sangareddy is characterized by semi-arid conditions and lies between 18.1610° N and 77.7406° E. Due to population growth and unplanned urbanization and industrialization large quantities of industrial and domestic waste water polluted the lake for the past 1-2 decades. The city’s dependence on this lake for drinking water has reduced in recent times and water from greater distance and high expense is procured to quench of thirst.
Methodology
The raw water samples from the Nallavagu lake are analyzed for the physicochemical characteristics for a period of one year from August 2017 to September 2018.The samples were analyzed for three seasons at different locations for a number of physicochemical and biological parameters using standard procedures recommended by American Public Health Association [6]and National Environmental Engineering Research Institute [7].
Water Quality Index (WQI) for assessment of Lake Water
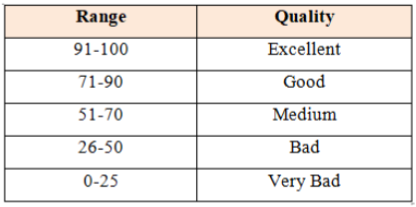
Water quality is affected by the quantity and quality of supplies coming from different sources. To provide a comprehensive but easy to use tool in the assessment and evaluation of water quality, the concept of Water Quality Index (WQI) has been developed [8]. It provides “ranking of water quality” with a single number that express overall water quality based on several parameters. Water quality index is calculated for Nallavagu lake using the protocol of National Sanitation Foundation (1970). It is determinedon the basis of 9 important parameters viz., pH, temperature, turbidity, total solids, nitrates, phosphates, dissolved oxygen, biochemical oxygen demand and Faecal coliforms. The average values of the samples at different locations for all the nine parameters are compared to the corresponding standard curves provided by the National Sanitation Foundation (NSF) (Brown 1970) and a numerical value or “Q-value” is obtained. Thus, water quality index is obtained after the Q-value is multiplied by a “weightingfactor” based on that particular test’s importance in water quality. The values range from 0-100 and the streams are classified from very bad to excellent.
The quality of the water, based on the WQI values is shown in Table 1
Results and Discussions
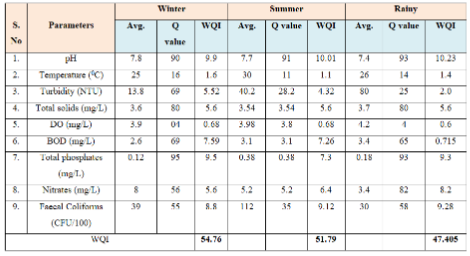
Mean values of physicochemical and biological parameters of raw water of Nallavagu lake of the three seasons –winter, summer and rainy for the calculation of water quality index are presented in Table 2.
The water quality index for winter, summer and rainy seasons are 54.76, 51.79 and 47.40 respectively. The WQI values for all the seasons indicate medium water quality of the lake. The water quality as per the WQI values is slightly poorer in rainy season than in winter and summer seasons. The poor quality in rainy season can be attributed to dissolution of various nutrients during rains and algal vegetation.
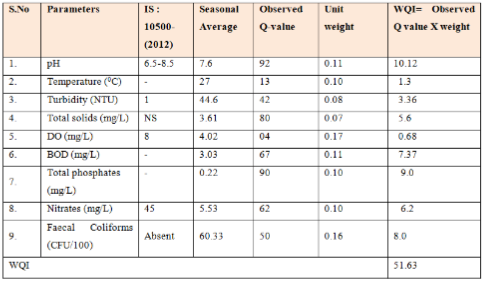
The overall water quality of the Nallavagu Lake by taking the average of three seasons is presented in Table 3.
The overall WQI value for Nallavagu Lake indicates slightly poor water quality of the lake. All the parameters studied are within the permissible limits of Indian Standards(IS:10500-2012).The presence of faecal coliforms indicate that the lake water is highly contaminated
Calculation of Correlation Coefficient (r)
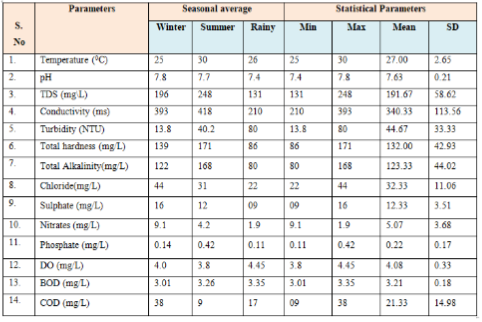
The correlation coefficient (r) between different parameter pairs is computed by taking the average values ofthe winter, summer and rainy seasons of the Nallavagu lake water. Correlation coefficient (r) between parameters x and y is calculated for parameters like water temperature, pH, total dissolved salts, electrical conductivity, turbidity, total hardness, total alkalinity, chloride, sulphate, nitrate, phosphate ,dissolved oxygen, biological oxygen demand and chemical oxygen demand. The average values of the physicochemical parameters for winter, summer and rainy seasons are shown in Table 4.
The correlation between various parameters is presented as a 14 x 14 Correlation matrix in Table 5
WT= Water temperature, TDS=Total dissolved salts, EC= Electrical conductivity, TUR= Turbidity, TH= Total hardness, TA= Total Alkalinity, Cl= Chloride, S= Sulphate, N= Nitrate, P= Phosphate, DO= Dissolved oxygen, BOD= Biological oxygen demand, COD= Chemical oxygen demand.
Conclusions and Recommendations
Quick urbanization and industrialization has led to unchecked proliferation of hazardous industries in and around Sangareddy. The area nearby Nallavagu lake has plenty possibilities of organic pollution, heavy metals and pesticides pollution from various sources viz., domestic waste water, agriculture/horticulture excess, laboratory waste from educational institutes and labs, solid waste disposal, vegetation in the lake and human activities. As a result, the water quality index of the lake is lowered to 51.63 indicating slightly ok water quality. The lake boundaries should be clearly demarked and restricted to stop violations & curb anthropogenic activities. The nonpoint sources of pollutants entering the lake including fertilizers, toxic pesticides and other chemicals from agriculture runoff should be recognized. The government should strictly implement GO-111 in cut all activities in the catchment area of the lake leading to deterioration in water quality. The authorities can think of introducing some precise types of fishes into the lake which would help in cleansing the water. The sewage water from the villages in the catchment area due to poor drainage system is another source of contamination which can be checked by constructing regional sewerage treatment plants. As the lake is closer to the city, protecting it from pollution is of extreme importance as the water can be a priceless resource in case of emergency.
References
- Fatima Moreno-Perez M, Jose Roldan-Canas (2013) Assessment of irrigation water management in the Genil- Cabra (Cordoba, Spain) irrigation district using irrigation indicators. Agricultural Water Management 120: 98-106.
- Vasanthavigar M, Srinivasamoorthy K, Rajiv Ganthi R, Vijayaraghavan K, Sarma VS (2012) Characterization and quality assessment of groundwater with a special emphasis on irrigation utility: Thirumanimuttar sub-basin, Tamil Nadu, India. Arab J Geosci 5: 245-258.
- 3. Indra V, Sivaji S (2006) Metals and organic compounds of sewage and sludges. J Environ Biol 27: 723-725.
- Hema Sailaja V, Anji Reddy M (2013) Investigation of Physico-chemical parameters to assess the Water Quality of Himayat Sagar Lake, Hyderabad. International Journal of Scientific Research 2(5):279-281.
- Shuchun Y, Bin X, Deyang K (2010) Chronology and nutrients change in recent sediment of Taihu Lake, lower Changjiang River Basin, and East China. Chin Geogra Sci 20(3): 202-208.
- APHA Standard methods for the examination of water and wastewater. American Public Health Association, (20th edn) Washington DC (1998).
- NEERI (1986) Manual on water and waste water analysis, National Environmental Engineering Research Institute, Nagpur-P-340.
- Fuzhan nasiri, Imran Maqsood, Gordor Huang and Norma Fuller (2007) Water Quality Index: A Fuzzy River- Pollution Decision Support Expert System. Journal of Water Resources Planning and Management 133(2): 95- 105.


